What you need data for
▶️ Quantitative data tells you where you have a problem on your website or e-shop and how big it is (for example, a low add-to-cart rate or a high bounce rate on a product detail page).
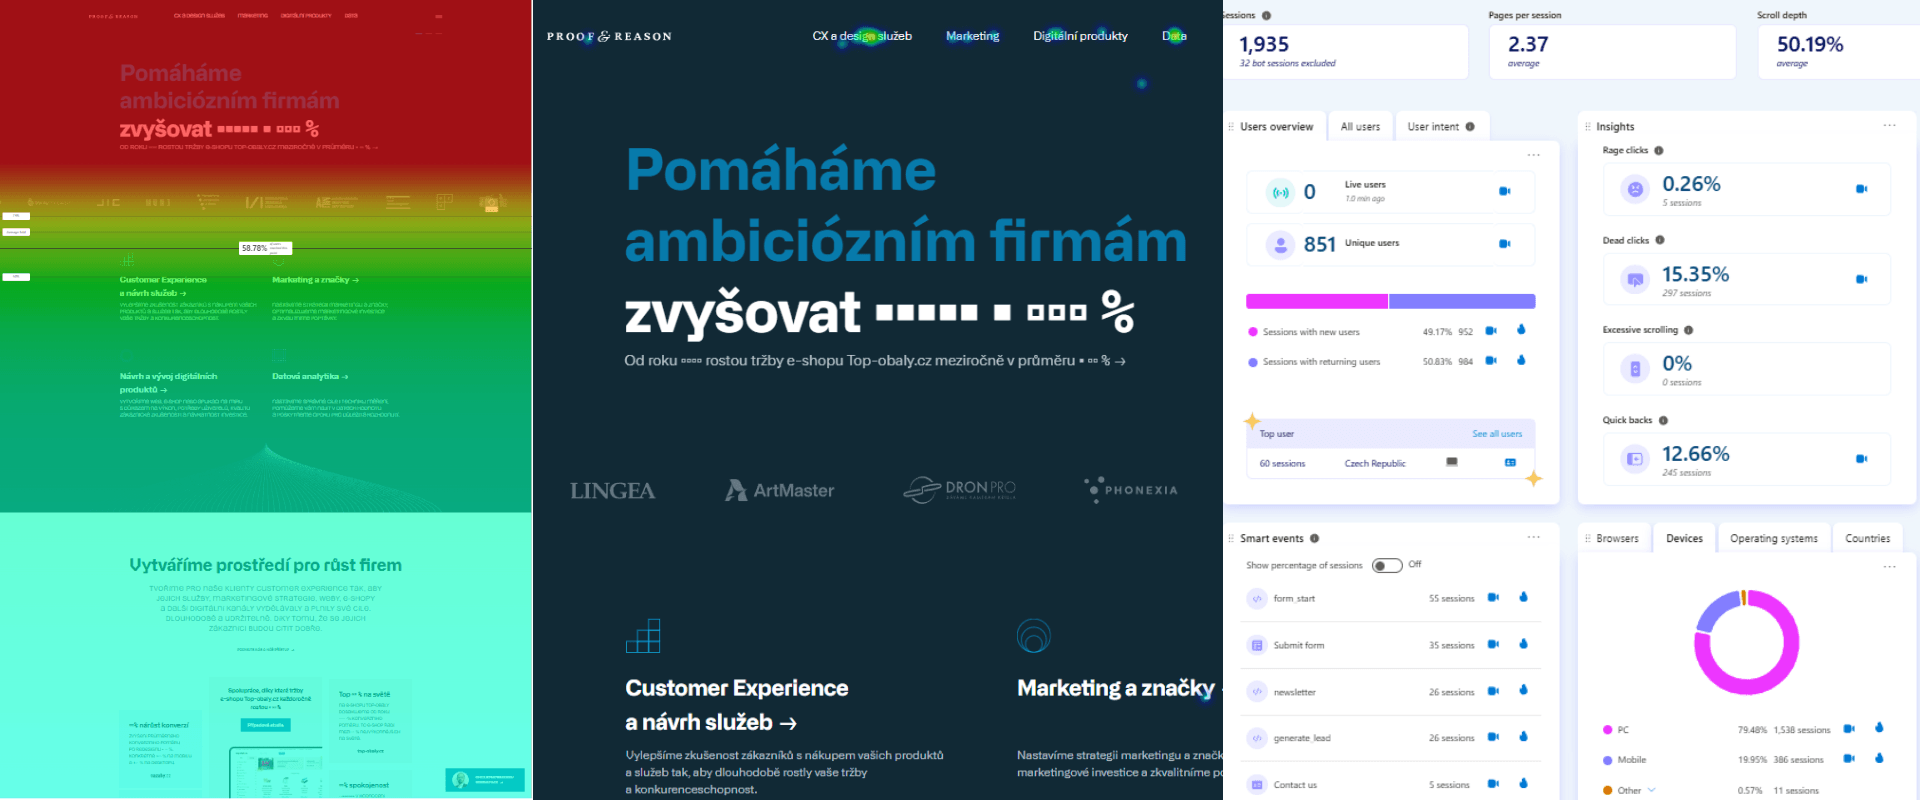
▶️ With qualitative data, you go and look at the specific problematic spot and find out what's happening there and why (data from heatmaps and recordings).

An example of using data to solve a client problem
1️⃣ From quantitative data (for example from Google Analytics) or from designers, we find out where customers are having trouble as they move through the e-shop. Where they spend a lot of time, where they spend little, or where they leave. For example, we find out that 70% of people are dropping off between step 2 and step 3 of the checkout.
2️⃣ We then look at qualitative data (for example in MS Clarity) to find out why they're leaving. In Clarity we work with heatmaps and recordings — we can see, for instance, where people click. In the recordings, we look at people who were at checkout step 2 but never made it to step 3.
3️⃣ Through data analysis, we might discover, for example, that customers opened the payment method section but there was no card option. Or that customers didn't want to enter a certain field and left after clicking on it.
Why Ondřej recommends MS Clarity
✔️ You don't need to add another new, often paid, tool — MS Clarity is free.
✔️ It measures up to 100,000 visits per day, and you have access to all its features.
✔️ The functionality and design are great.
More of Ondřej's tips
➡️ Basic data filtering covers common things, for example:
- Actions: Cursor movement, text input, text selection, page resize
- Web performance: Largest Contentful Paint (load time of the largest page element), First Input Delay (response time to first interaction), Cumulative Layout Shift (visual element stability)
➡️ MS Clarity loads asynchronously, so it doesn't significantly slow down a website. Data is stored on secure servers and you can set the level of "masking."
➡️ Recordings can be played back at speed and you can skip "dead" spots.
➡️ You can choose the screenshot on which the heatmap is displayed.
Want to know more about MS Clarity?
Or would you like to see how to work not only with this tool, but with data and its evaluation in general? Our data team is at your disposal — just reach out at ondrej.svec@proofreason.com, or message us directly here.
In it you'll find, for example:
- The full presentation on MS Clarity by Ondřej Švec.
- The first-ever Czech podcast about CX, featuring leading Czech CX expert Lukáš Pítra.
- How to communicate with customers after a purchase without annoying them — advice from our researcher Klára Brožovičová.
- A case study of our client Top-obaly, where we've been improving CX for 12 years, helping the e-shop's revenue grow by 40% every year.
- 5 key CX trends for 2025, plus a look at the potential pitfalls of the ROI metric in marketing from the perspective of Les Binet, an expert on advertising effectiveness.