Did product X sales increase because it is being searched more? Did an email campaign work? Or perhaps the improved product detail photos made a difference?
You could get a crystal ball — or, for a similar price and with a more reliable outcome, invest in the proper setup of Enhanced E-commerce in Google Analytics.
What can Enhanced E-Commerce in Google Analytics do?
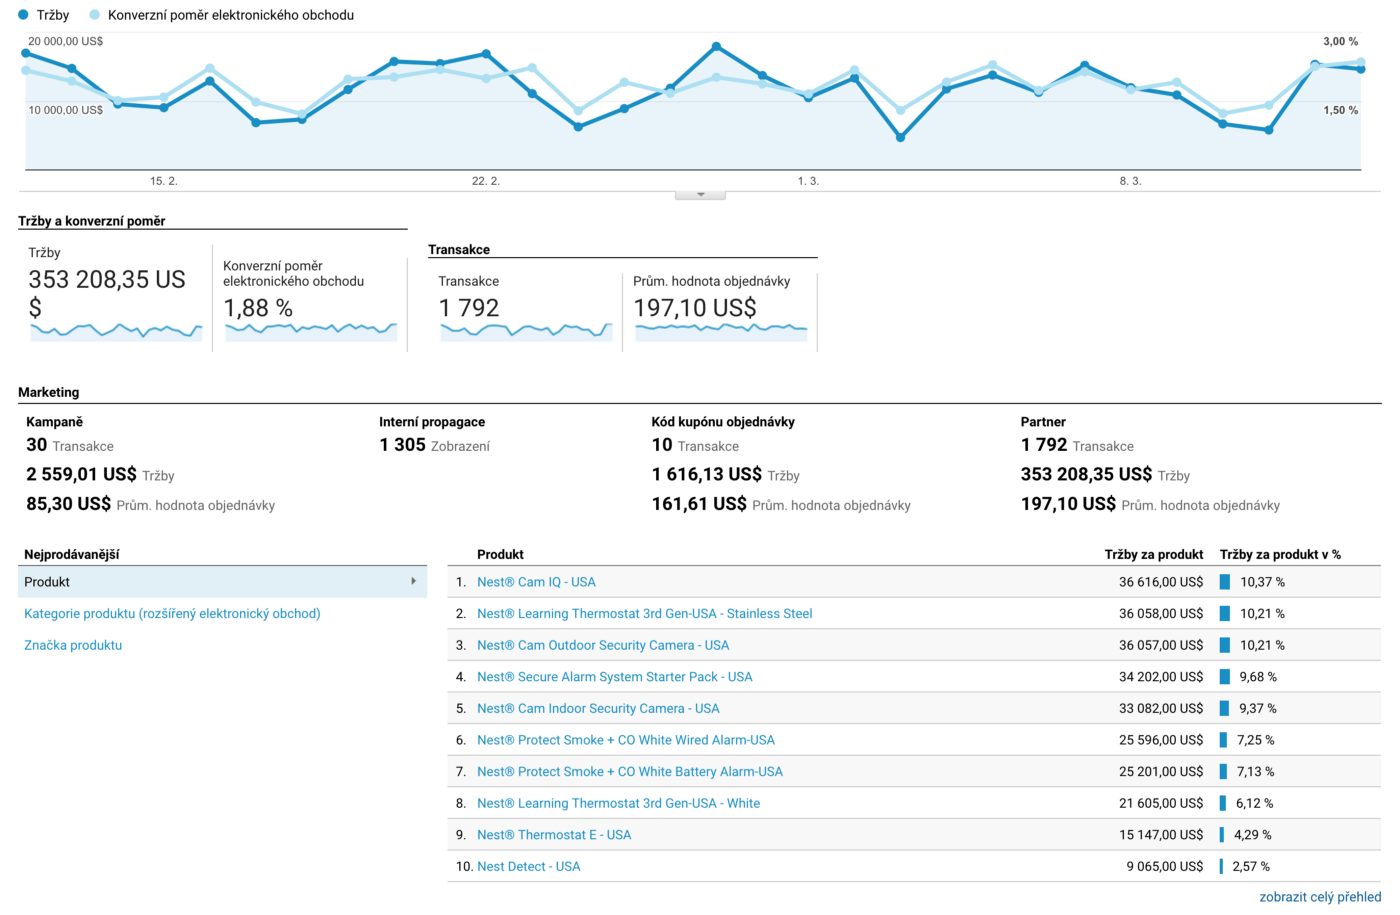
It measures placed orders — so you know how much your website is earning and which products visitors are buying.
It records checkout flow — you can see whether customers are dropping off at any step, so you have an idea of where to start optimising.
And the best part: you can also measure product views and user actions — adding and removing items from the cart. Now you finally know whether a product is not selling because its page is not compelling — or simply because no one ever saw it.
One simple table
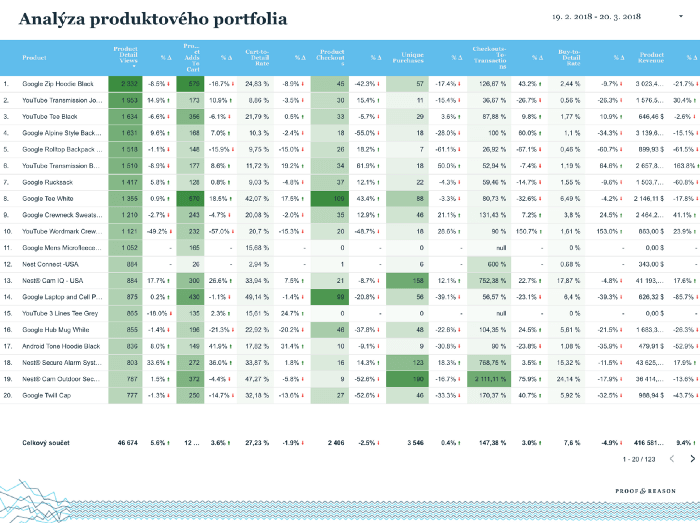
All this data can be summarised in a clear table. One approach was presented by Peter O'Neill at Marketing Festival in 2014. We have prepared a template in Data Studio — all you need to do is connect your Google Analytics account and add one additional calculated field:
- Open the sample report. It is pre-filled with data from the Google Demo Store, which has public access to its GA.
- Copy the report template. The icon in the top right shows two overlapping sheets. A detailed guide is available in Google Help.
- Connect your data source — Data Studio will guide you through this process quite intuitively. A detailed walkthrough is also available in Help.
- The report contains data from Google Analytics and one metric we calculate ourselves. To avoid errors before saving the data source, add one calculated field:
- Click +, name the new field something like Purchase Completion Rate, copy the value “calc_vkYCjv7k” into the ID field (this will make it appear in the report automatically), and in the formula enter Unique Purchases / Product Checkouts. Product Checkouts is the number of times a given product was in the cart, Unique Purchases is the number of times it was part of a completed transaction. This gives you the purchase completion rate for the product. Since we are working in percentages, after saving the field adjust its type to percentage in the table.
- If your interface is in a different language, make sure you use the correct field names. When in doubt, switch the interface to English.
- Instructions for adding a custom column can also be found in Data Studio Help.
Done. Now what?
You can easily spot your bestsellers. Most-visited products, most-purchased products, cash cows. This will boost your confidence before you start hunting for problems.
Focus on low ratios. Is a product highly visited but rarely purchased? Pick up your magnifying glass and start investigating:
- Is the product in stock, or sold out? If unavailable, redirect visitors to alternatives.
- For in-stock products, check the traffic source. Is there a poorly targeted PPC campaign sending people there?
- The problem might be in an unconvincing description or product photos. Suggest a change and validate it, perhaps with an A/B test.
From the other angle: does a product have above-average conversions? Support it with additional marketing communication and drive more traffic to it.
Do not forget to monitor trends and changes compared to the previous period. In Data Studio these are the columns with coloured arrows. They will alert you to growing product popularity (stock up) or declining interest (start looking for alternatives).
I want to look at the data from a different angle
You can replace the product name column with product variants. Or categories. Or manufacturer. Whatever makes sense to you.
If your Google Analytics implementation differs or you have a more complex e-shop structure, a simple visualisation tool like Data Studio may not be the right fit, and you might prefer Power BI or complex formulas and data imports in Google Sheets. Not sure you can handle it? We can. And we would be happy to help.
Summary
- Check that Enhanced E-Commerce is implemented in your e-shop. A simple test is to look at Conversions → Ecommerce → Product Performance. If you do not see an empty table, you are probably good to go.
- Copy our template and connect it to your data source.
- Look for top-performing or problematic products. It will serve as your jumping-off point for further exploration in Google Analytics.
Article by: Jan Kadlec, data analyst